Cycling Out Of Control: Global Nitrogen
- Olivia Chick

- Dec 20, 2020
- 4 min read
Updated: Jan 10, 2021
After writing one of my last blogs looking at the eutrophying emissions of different foods, I decided to investigate the biogeochemical flows planetary boundary.This week I am looking at the nitrogen cycle and exploring to what extent has fertiliser use for agriculture pushed this boundary past the zone of uncertainty.
Anthropogenic Nitrogen Fixation
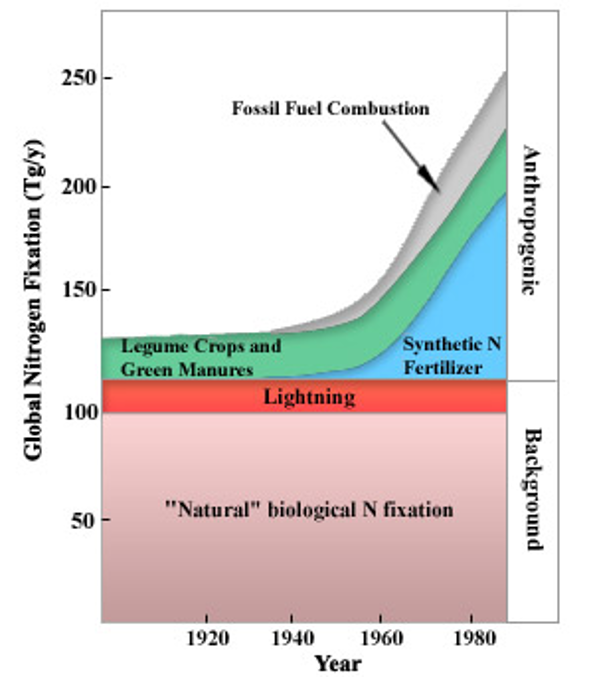
In the early twentieth century, the Haber-Bosch process was industrialised allowing atmospheric nitrogen to be converted to reactive ammonia (figure 1). Ammonia forms the base of synthetic N fertilisers and therefore this process revolutionised farming and lead to a rapid expansion of food production. Human processes, including the manufacture of fertilisers, convert around 120 million tonnes of nitrogen from the atmosphere per year into reactive forms. This is more than all the natural fixation processes combined (figure 2). Much of this reactive nitrogen ends up polluting waters, collecting in land systems and adding toxic gases to the atmosphere including nitrogen oxides (NOx) and nitrous oxide.
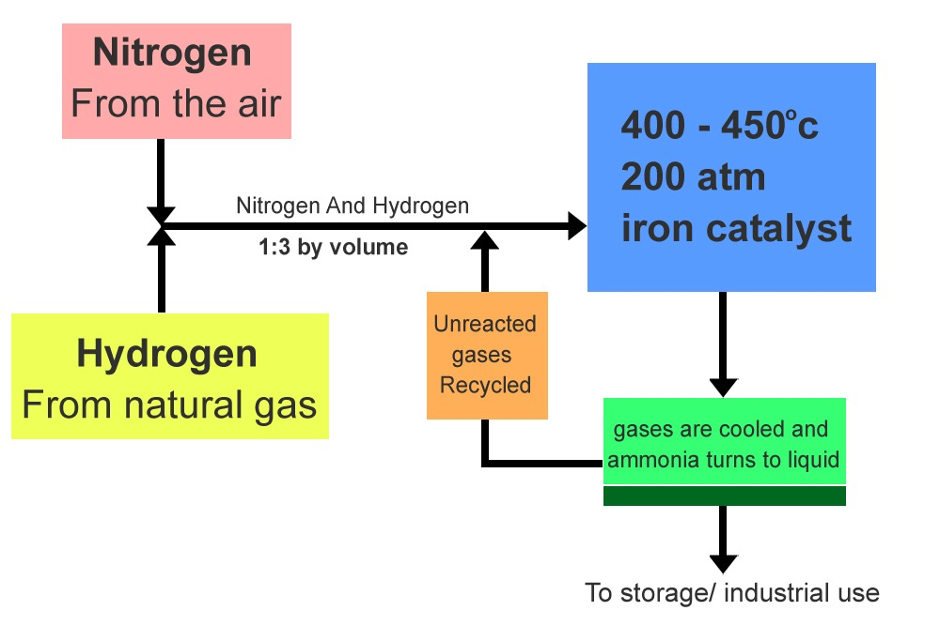
Figure 1: Haber-Bosch process
Ice core and lake sediment analysis
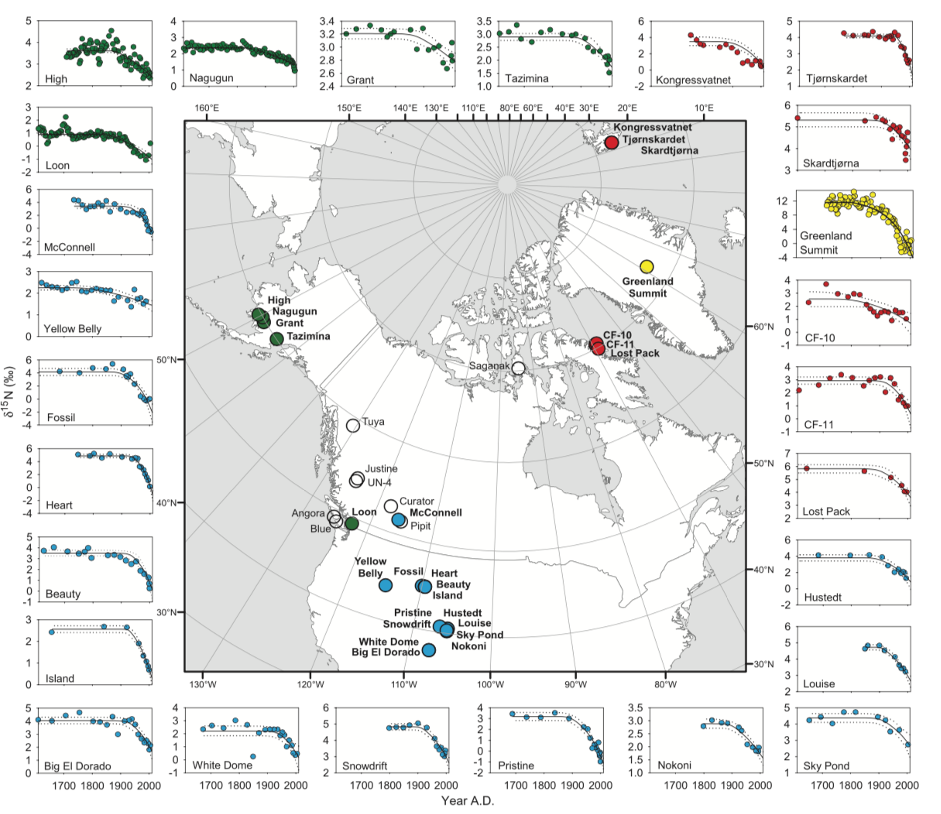
To investigate the source of NOx emissions, scientists have been exploring changes in the 15-Nitrogen: 14-Nitrogen isotope ratio (δ15N) found in gas bubbles in ice cores and lake sediments. This analysis enables increased understanding of the role of different human activities on ecosystem health, air and water quality.
Looking at the isotope ratio of nitrogen is useful for assessing the source of NOx emissions because δ15N in industrial NOx is significantly higher than in agricultural or natural sources (table 1).

A 2013 study found increases in twentieth-century fertiliser use led to an increase in biogenic soil NOx emissions that caused a steep negative δ15N-NO3− trend in a Greenland ice core. Similarly, the results from a 2012 study found decreasing δ15N-N20 from Antarctica cores was linked to increased microbial activity from fertiliser use. This trend is also present in lake sediment analysis, for example, a 2011 study noted a decline in δ15N in 25 Northern hemisphere lakes (figure 3).
However, changes in δ15N-NO3- explained by source emission type has been contested in several studies. Geng et al. 2014 dismissed the influence of δ15N-NO3− source signatures and interpreted the changes in the isotope ratio as a product of the chemical partitioning of NO3-, which is influenced by anthropogenic emissions. Another study found post-depositional processes caused the increase of δ15N in older sediments and ice cores.
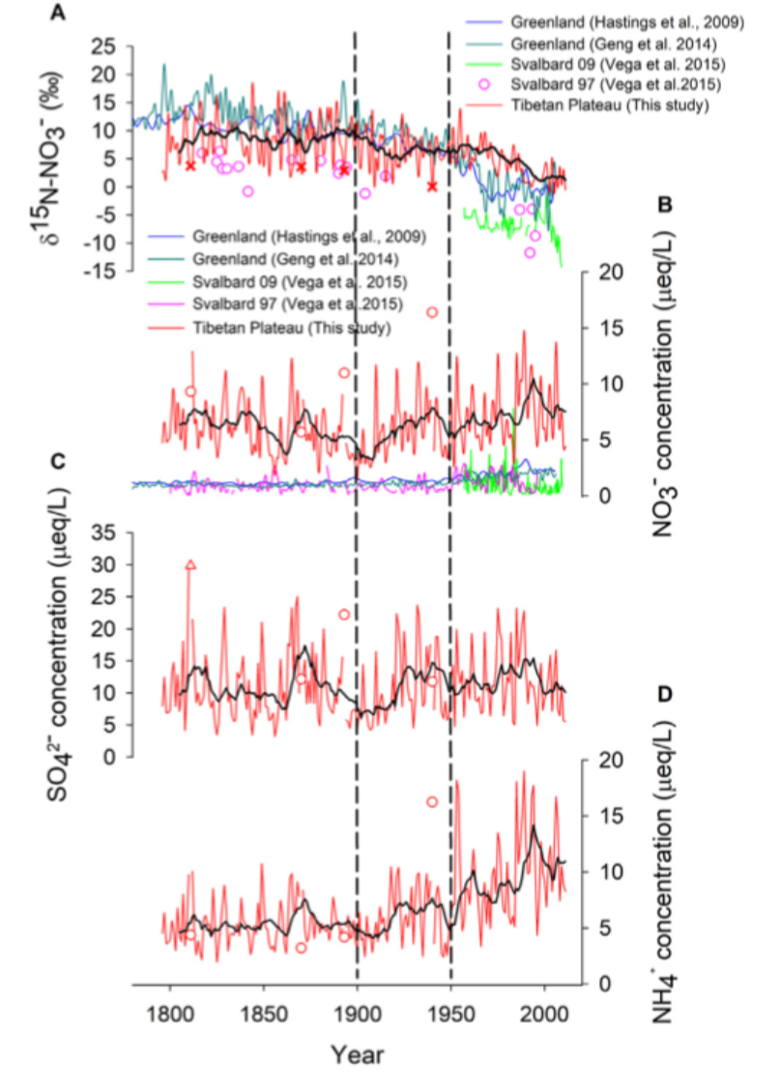
A 2020 study has proposed a new framework for looking at δ15N-NO3-, including source emissions and atmospheric chemistry processes. This study found that before 1950, natural climate variability determined δ15N-NO3−, whereas after 1950 nitrogen deposition driven by anthropogenic fertiliser caused the sharp decline of δ15N-NO3− in a Tibetan Plateau core. This idea is supported by other markers in the ice core including a significant correlation between nitrate and ammonium concentrations (an important emission from agriculture) and an insignificant increase in sulphate concentration (due to the lack of sulphur dioxide emissions from agriculture) (figure 4).
This analysis has provided insight into what extent anthropogenic fertilisers are disrupting the natural nitrogen cycle. Looking at δ15N is a powerful tool verifying whether reactive nitrogen emissions by agriculture are in line with environmental policies and thus helping to limit the negative effects of reactive nitrogen on the environment.
Reactive nitrogen and the environment
In this section of the blog, I will look at the impact of synthetic fertiliser on the nitrogen cycle at two points. First, the impact of nitrate leaching from the soil (figure 5, part 7) and second, the release of nitrous oxide and nitrogen oxides into the atmosphere (figure 5, part 8.).

Figure 5: The nitrogen cycle 1. uptake of nitrogen by plants, 2. uptake of ammonium and nitrate by plants, 3. ammonification, 4. nitrification, 5. denitrification, 6. nitrate immobilization by soil absorption, 7. nitrate leaching from the soil, 8. release of ammonia, gaseous nitrogen, nitrous oxide and nitrogen oxides into the atmosphere.
Nitrogen in the water
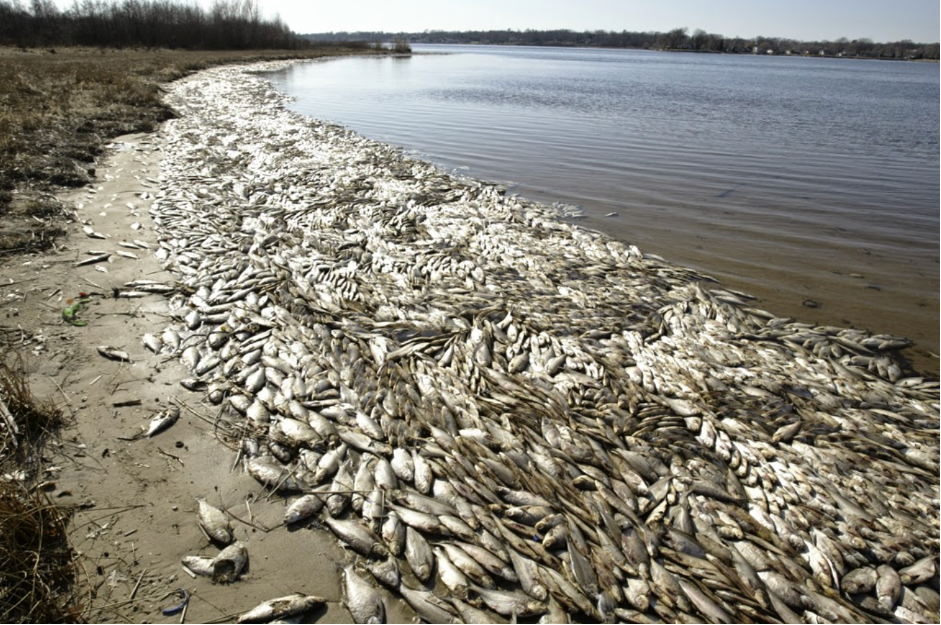
When soluble nitrates from fertilisers are leached off crop fields, they enter aquatic environments and cause algal blooms. These blooms rapidly deoxygenate ecosystems leaving dead zones (a process called eutrophication) (figure 6). The largest dead zone is the 5800 square mile area in the Gulf of Mexico, where deoxygenation has fallen below 2ppm, predominantly due to fertilisers from the Mississippi River.

Figure 6: How the Gulf of Mexico dead zone formed
Nitrogen in the air
Nitrous and nitrogen oxides increase with fertiliser use as a by-product of microbial denitrification. These gases are associated with several environmental problems. At mid-altitudes nitrous oxide acts a green-house gas 300 times more potent than carbon dioxide and at high altitudes, it can destroy ozone. Furthermore, nitrogen oxides cause the formation of smog and ground-level ozone when in the atmosphere and cause acidification of aquatic and terrestrial systems when deposited back to earth.
Solutions
Although we can’t stop using fertilisers completely, there are several steps we can take to tackle these issues.
Some simple steps forward:
Time fertiliser application to avoid rain because it increases leaching and wet soil microbes produce more nitrous oxide.
Ensure fertiliser is applied to crops in amounts the plants can absorb.
Rotate crops to retain soil fertility.
Reduce beef consumption as this food has the highest eutrophying emissions per 100g of protein, due to the extent of fertilised cropland needed for cattle feed.
Change to greener fertilisers such as the nano-fertiliser, where only a few grams are needed per acre, therefore eliminating waste.


Comments